Use the examples in this section to become familiar with the basic steps for calculating a sum or other aggregate function in the Table Data Field data source.For each example, you must first create a new table object that is connected to a sample database and then configure a Table Data Field data source, as described in the following procedure.
The examples in this section require that you create a text file database that has a table that includes a Product field, a State field, and a Price field, such as the following sample database.
|
Product
刀
Dish towel
Coffee mug
叉子
勺子
鉗子
Hot pad
Dinner glass
Wine glass
刮勺
Teacup
Juice glass
平底玻璃杯
|
State
WA
OR
CA
WA
WA
WA
OR
CA
CA
WA
CA
CA
CA
|
類型
Cutlery
Linens
Glassware
Cutlery
Cutlery
Implement
Linens
Glassware
Glassware
Implement
Glassware
Glassware
Glassware
|
Price
2.99
12.99
6.99
2.99
2.99
3.99
8.99
3.99
6.99
4.79
5.59
1.99
4.99
|
After you create the sample database, add a table object to your template that is connected to the database, and then sort the database fields according to the value in the State field.This procedure simultaneously creates a Table Data Field data source that appears on the Data Sources pane of the Toolbox.
 To add a table object that is connected to your database and then sort by the State field
-
在物件工具列上,按一下  圖示。或者,也可以按一下「建立」功能表上的「表格」。
-
按一下「從資料庫建立表格」。The Database Setup wizard starts.
-
Complete the wizard to connect to the sample database.
-
In the Database Setup dialog, click Sort Order.
-
In the Available Fields list, double-click State to add it to the Fields to Sort By list, and then click OK.
-
Click the template at the location where you want to add the table object, and then drag the sizing handles to fit the table within the template.
In this example, you will use the Table Properties dialog to configure a new row for the Sum aggregate function and then add the function, which will sum the prices for each State group.
To configure the table properties
-
開啟「表格內容」對話方塊。若要執行此動作,請按兩下表格物件。或者,右鍵按一下物件,然後按一下「屬性」。
-
在導覽窗格中,按一下「列」以顯示「列」屬性頁面。
-
In the Rows area, click  to add a new row.
-
In the Row Properties area, under Table Data, follow these steps:
-
Click Template, and then select Group Footer in the list.
-
Click Group By, and then click to select the State check box in the list.
-
Click Page Break, and then select Yes in the list.The table object displays a new, empty row.
-
Click Close to close the Table Properties dialog.
To add the Sum aggregate function
-
On the Data Sources pane of the Toolbox, expand the Table 1 node under the Table Data Fields node.
-
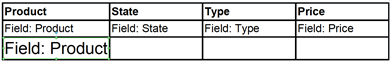
Drag the Price data source to the bottom right table cell under the existing Field:Price cell, as shown.
-
Right-click the Field:Price object that you just created, and then click Properties to open the Text Properties dialog.
-
On the Data Source tab, verify the following:
-
The Calculate sum or other aggregate function check box is selected.
-
The Function option is set to Sum.
-
The Range option is set to Current Group.
-
按一下「關閉」。
-
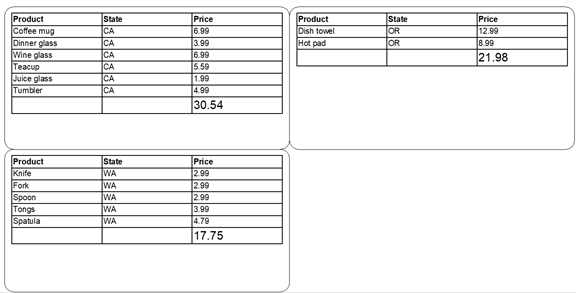
Click Print Preview.Your items appear on three labels, grouped by the State field, with the total price calculated for each state and shown in the aggregate field that you added.
In this example, you will use the Table Properties dialog to configure a new row for the Count aggregate function and then add the function, which will count the number of products that are in each State group.
To configure the table properties
-
開啟「表格內容」對話方塊。若要執行此動作,請按兩下表格物件。或者,右鍵按一下物件,然後按一下「屬性」。
-
在導覽窗格中,按一下「列」以顯示「列」屬性頁面。
-
In the Rows area, click to add a new row.
-
In the Row Properties area, under Table Data, follow these steps:
-
Click Template, and then select Group Footer in the list.
-
Click Group By, and then click to select the State check box in the list.
-
Click Page Break, and then select Yes in the list.
-
Click Close to close the Table Properties dialog.The table object displays a new, empty row.
To add the Count aggregate function
-
On the Data Sources pane of the Toolbox, expand the Table 1 node under the Table Data Fields node.
-
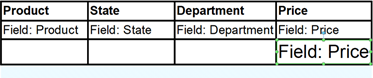
Drag the Product data source to the bottom left table cell under the existing Field:Product cell, as shown.
-
Right-click the Field:Product object that you just created, and then click Properties to open the Text Properties dialog.
-
On the Data Source tab, verify the following:
-
The Calculate sum or other aggregate function check box is selected.
-
The Function option is set to Count.
-
The Range option is set to Current Group.
-
按一下「關閉」以關閉對話方塊。
-
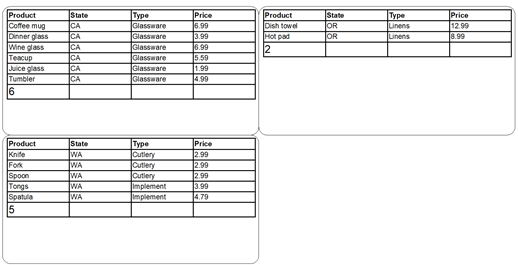
Click Print Preview.Your items appear on three labels, grouped by the State field, with the total number of products calculated for each state and shown in the aggregate field that you added.